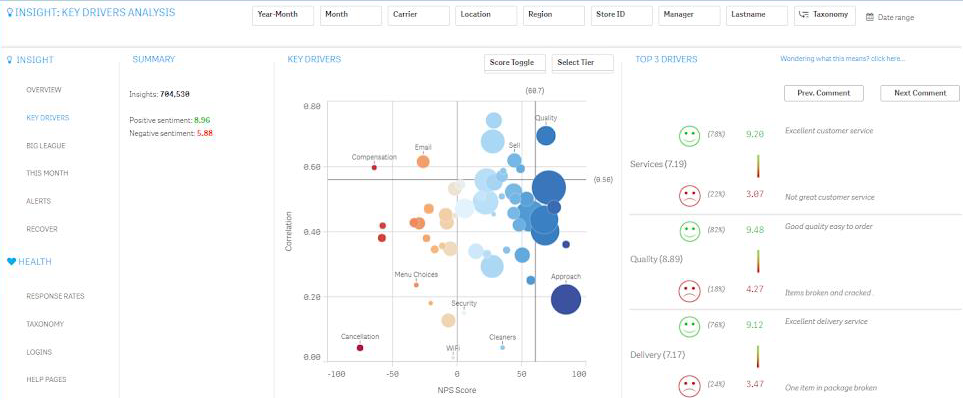
The Key Drivers sheet identifies the aspects of your business that, if improved, will have the biggest impact on your overall customer experience.
To make selections and update the report:
-
Click a data point in a chart or graph in the content area of a sheet.
All associated visualisations are updated immediately. A confirmation box displays around the selection.
-
To confirm the selection, click the Tick (
 ) icon or press ENTER.

The following table describes the sections of the Key Drivers sheet:
| Section | Description and actions |
|---|---|
|
SUMMARY |
Displays the total number of insight items you have received, the average given score for comments which contain a positive sentiment and the average given score for comments which contain a negative sentiment. |
|
KEY DRIVERS |
Identifies how strongly each Taxonomy category correlates to overall customer sentiment. A “four box” plot displays the results.
|
|
TOP 3 DRIVERS |
Shows the three categories that have the highest correlation to overall customer experience. The top three categories can change depending on the filters applied. For each category, the following items are displayed:
|